

ESP32 Status Dashboard
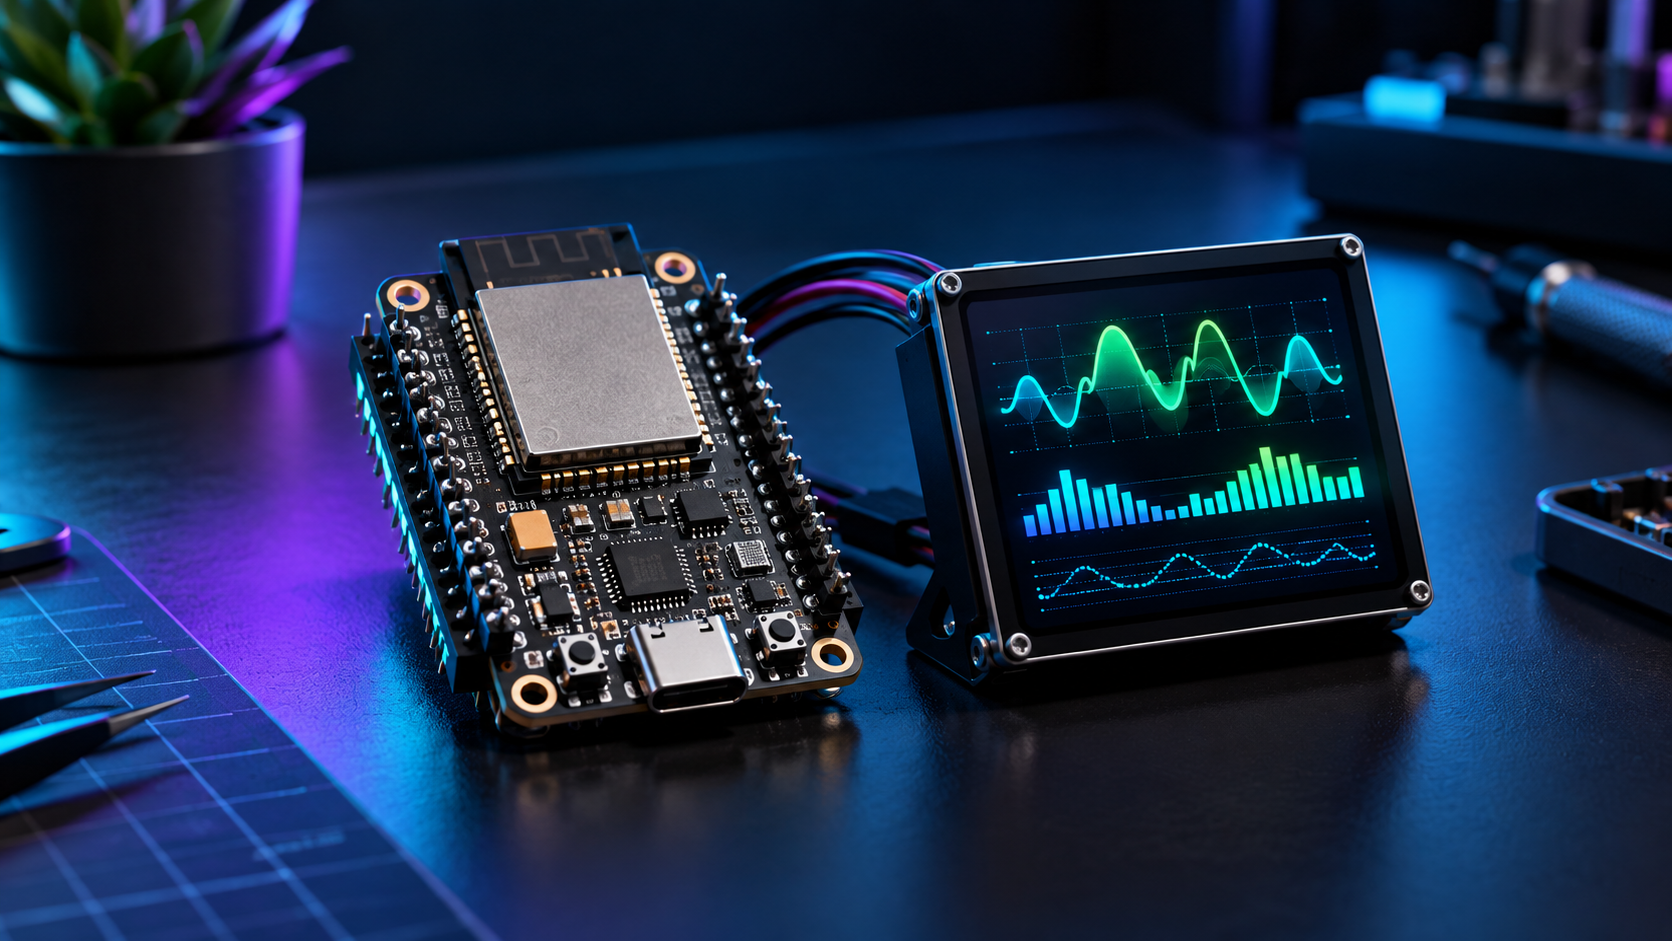
An ESP32-hosted, responsive local web dashboard that displays the JSON feed produced by Website Health Monitor.
Use cases
- Keep a small local status appliance for your services
- View availability, HTTP status and latency from a phone
- Reuse one feed with the E-Ink Desk Hub
Components
- ESP32 development board with USB power and MicroPython v1.25 compatible firmware
- Computer or Raspberry Pi running Website Health Monitor
- Trusted Wi-Fi network and a phone or desktop browser
Architecture / wiring
HTTPS sites → monitor.py → status.json → ESP32 main.py → local responsive browser dashboard
Match the exact hardware model stated above. Keep the LAN services on a trusted private network.
Build instructions
- On a trusted LAN computer, run monitor.py with –interval 300 –serve –host COMPUTER-LAN-IP and one or more HTTPS URLs.
- Flash MicroPython on the ESP32. Copy config.example.py to config.py and set Wi-Fi and STATUS_URL to http://COMPUTER-LAN-IP:8765/status.json.
- Copy main.py and config.py to the board, reset it and read the printed IP.
- Open http://ESP32-IP/ from a phone or desktop browser. The page refreshes every 30 seconds; the feed changes on the monitor schedule.
Code, firmware and files
The downloadable source pack contains: main.py firmware, config.example.py template, README.md and the monitor.py companion source. Open the folder named esp32-status-dashboard after extracting the ZIP. Start with its README and run the local check below.
python ../website-health-monitor/monitor.py --self-test
Validation
Firmware syntax and the companion monitor self-test passed. LAN and board behavior await a physical ESP32.
Run the listed checks on your own setup before relying on hardware results.
ESP32 Status Dashboard setup notes
The ESP32 Status Dashboard is a small local web appliance. It does not probe public websites itself. Instead, Website Health Monitor performs the checks on a computer or Raspberry Pi and writes a JSON feed; the ESP32 reads that feed and serves a responsive status page to devices on your trusted Wi-Fi network. Set up the monitor first and confirm that its JSON output contains the services and timestamps you expect.
Flash the compatible MicroPython firmware, then configure your Wi-Fi credentials and the LAN URL of the monitor feed in the provided source. Use the computer’s reachable LAN address rather than localhost: localhost on the ESP32 points back to the board. Power the board, open the address printed on its serial console, and check the dashboard from both a desktop browser and a phone. If data does not appear, inspect the feed URL, Wi-Fi connection, firewall, and whether the monitor is currently running.
The free build provides a browser dashboard; a physical display is not required. Keep the feed on a trusted network and do not publish Wi-Fi credentials in a repository. Confirm pins, networking behavior, and firmware installation with the official MicroPython ESP32 quick reference. This software path can be self-tested before hardware assembly, but real network and board behavior still needs checking on your equipment.
FAQ
Why is data old?
The browser refresh interval and monitor check interval are separate.
No cards?
Check the monitor LAN IP, firewall and status.json address.
Is an OLED included?
The free version is viewed in a browser; no attached display is required.
Next step
Build the free edition, then adapt it to your desk. Historical charts and notifications could follow later. These are future plans, not features in this download.